ChatMDV Tutorial: How to Use ChatMDV
This tutorial guides you through using ChatMDV step-by-step: uploading data into MDV, creating projects, exploring your dataset, and leveraging ChatMDV (the built-in LLM assistant) to generate insights and visualizations.
We’ll use the pbmc3k single-cell RNA-seq dataset as our example throughout this guide.
1. Introduction
-
What is MDV?
MDV (Multi-Dimensional Viewer) is an interactive browser-based platform for visualizing, annotating, and sharing large, complex datasets. -
What is ChatMDV?
ChatMDV is the LLM-powered assistant integrated into MDV. It allows you to interact with MDV using natural language — requesting plots, summaries, or insights without writing code or manually configuring charts. -
Why use it?
Researchers can upload datasets, explore them with MDV’s visual tools, and use ChatMDV to accelerate discovery through conversational commands. -
In this tutorial, you will learn how to:
- Upload data into MDV and create a project
- Navigate the ChatMDV interface
- Use ChatMDV to generate plots and summaries
2. Uploading Data
For this tutorial, we’ll use an MDV project version of the the pbmc3k dataset, which is available to download by clicking here.
- Open MDV in your browser (http://localhost:5055 for local use).
- If MDV is not installed or deployed follow the instructions in the Installation manual. Make sure the chat_enable flag is on to allow for ChatMDV to be enabled.
- Click "Import an existing project".
- Upload the downloaded pbmc3k dataset project file.
- Once uploaded the default view for the dataset will appear.
Important notes:
If you have your own anndata h5ad file containing single cell RNA sequencing data, you should preprocess the dataset outside of the container using the instructions in the Project creation tutorial and then upload that zip file into MDV by clicking on the "Import an existing project".
3. Understanding a Project
- A Project in MDV includes:
- Datasets (tables, variables, metadata)
- Visualizations (charts)
- Annotations & Views (saved analysis layouts)
- After loading data, adding charts and views save your project via:
File → Save Project
4. Navigating the Interface
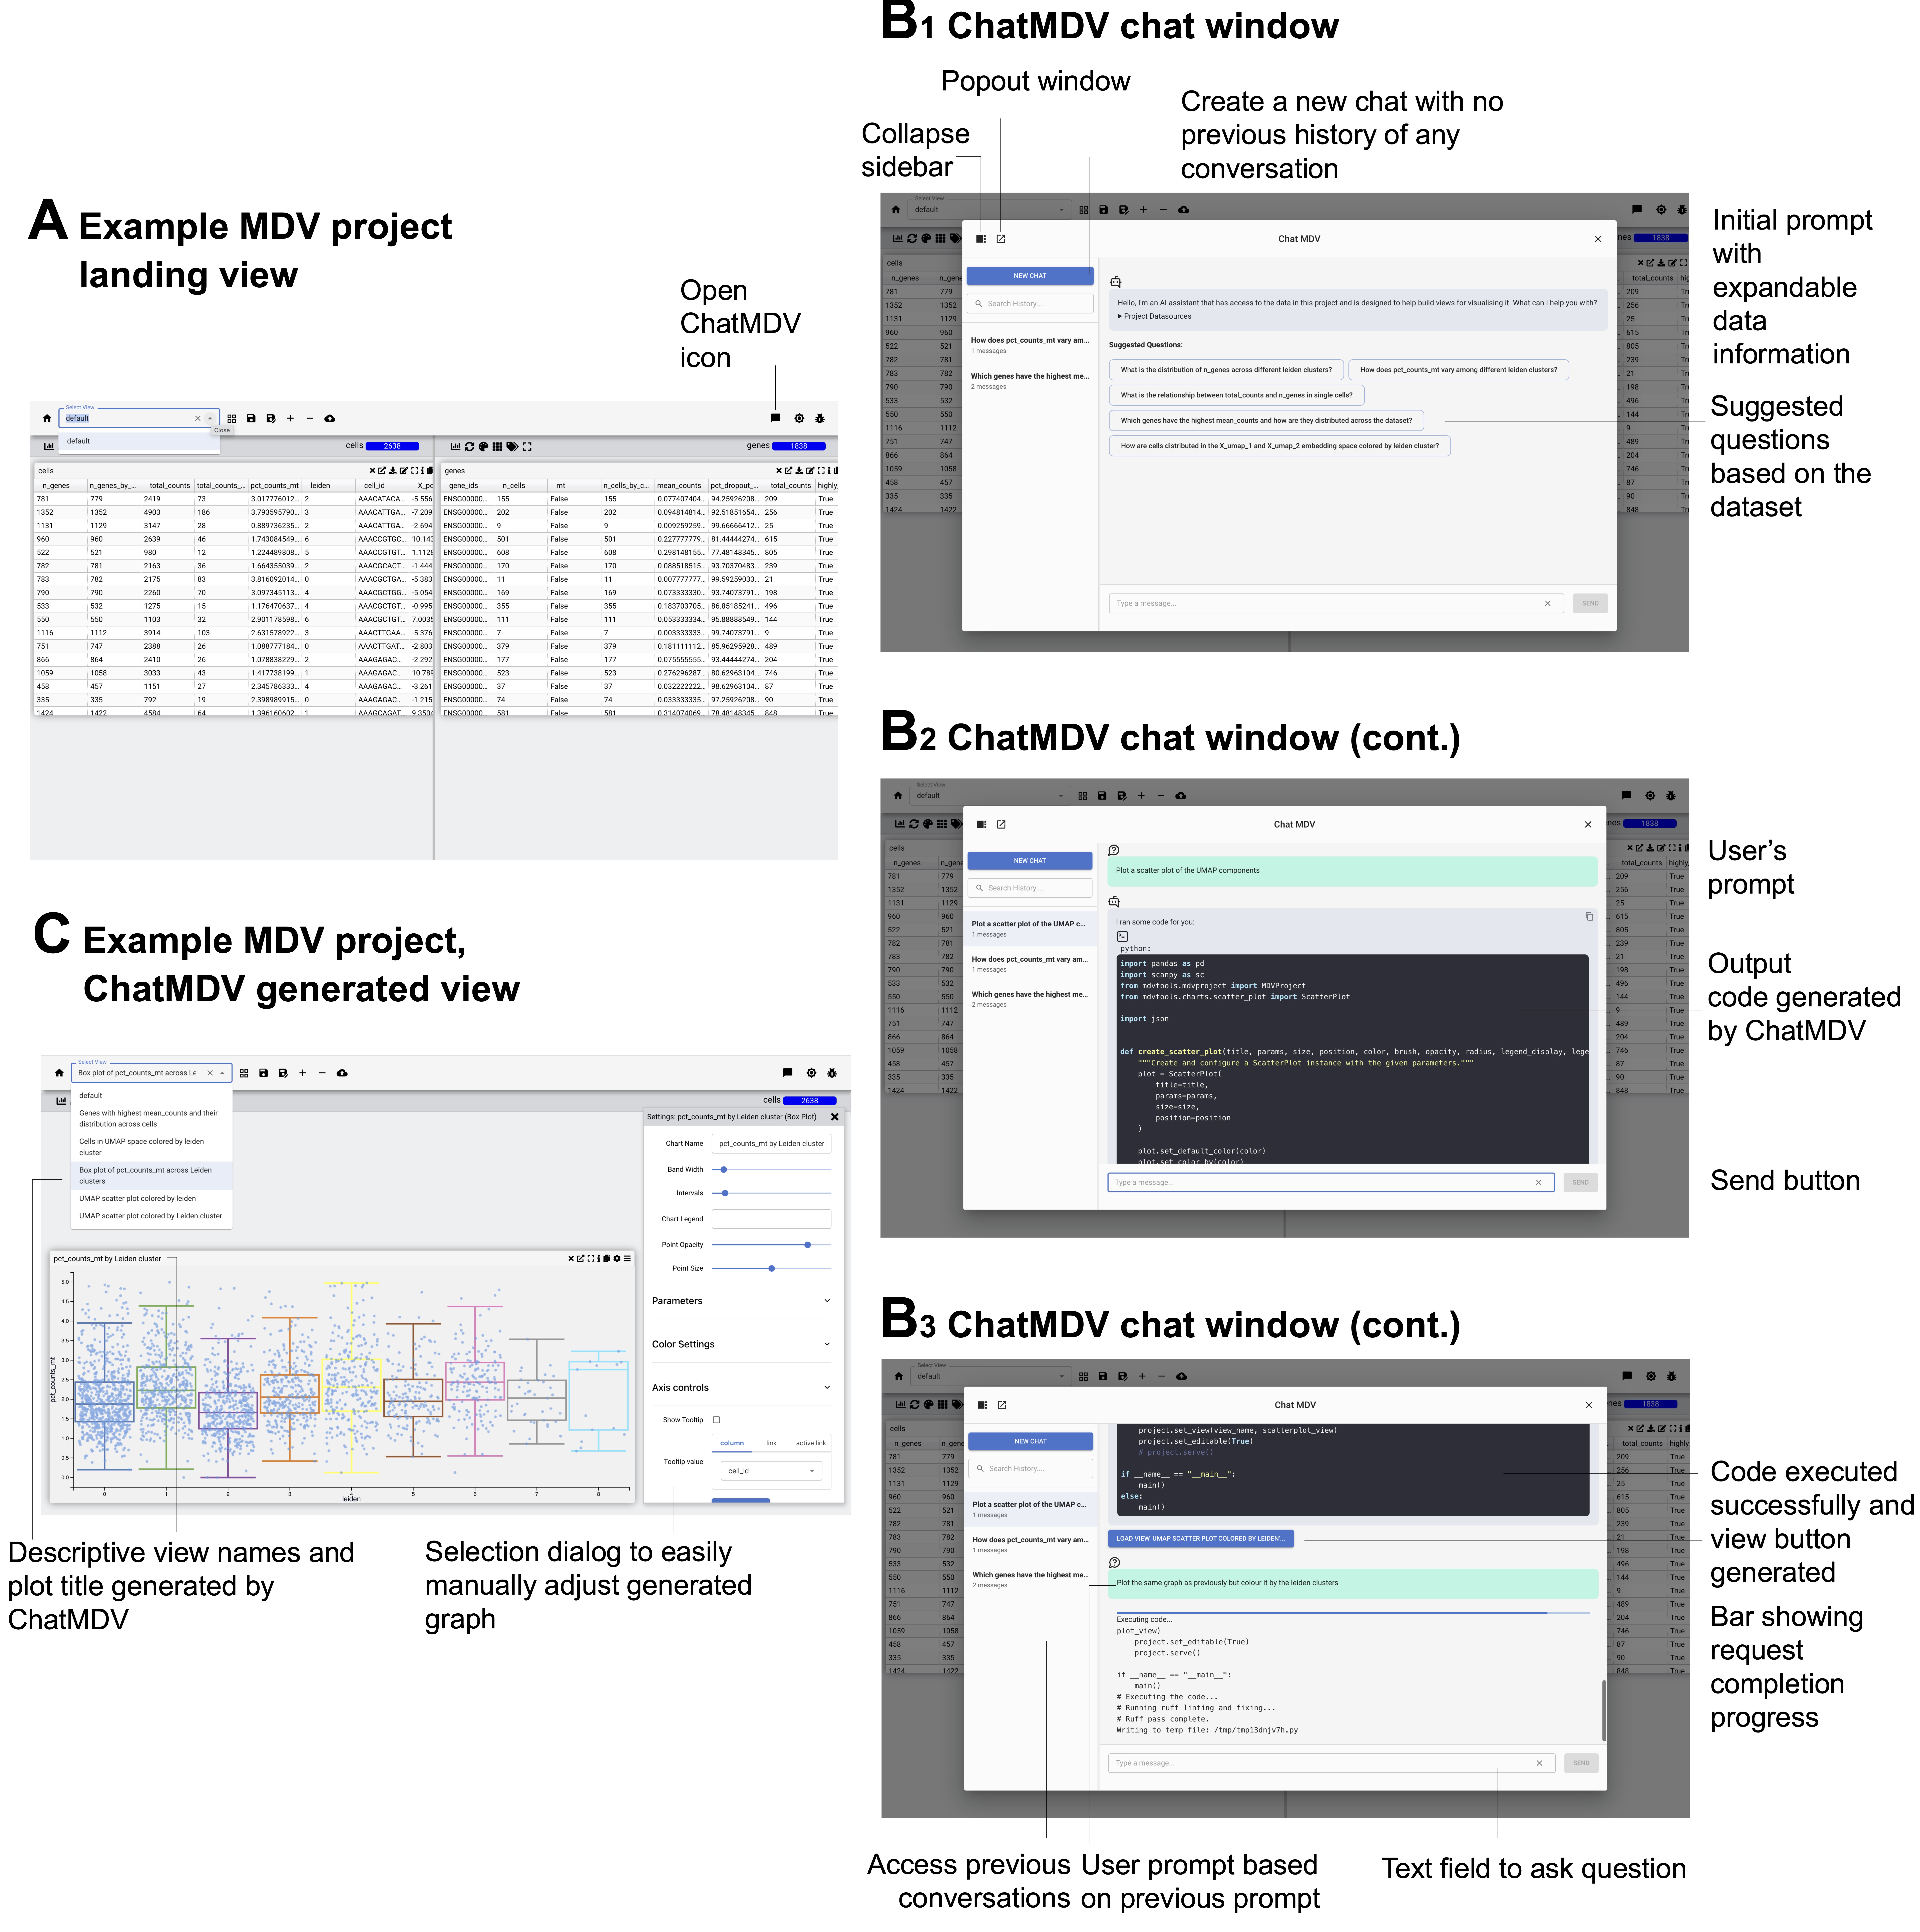
The MDV interface with ChatMDV is organized into different panels and workflows, illustrated in the interface diagram.

A. Example MDV Project Landing View
- When you first load a dataset (e.g., pbmc3k), you see the MDV landing view.
- The dropdown (left) shows available views in the project.
- The Visualization Area (center) displays default plots such as a table of the data.
- Use the Open ChatMDV icon (top right) to activate the assistant.
B1–B3. ChatMDV Chat Window
The ChatMDV chat panel appears on the right when opened:
-
B1 (Initial view):
- Start a new chat (with no prior history).
- View expandable dataset information.
- See suggested questions generated automatically based on the dataset.
-
B2 (User query):
- Type your own prompt into the chat box, e.g., “Plot a scatter plot of the UMAP components”
- ChatMDV reformulates the request based on previous interactions if they exist, generates output code, and prepares a chart.
- Use the Send button to execute queries.
-
B3 (Execution & results):
- The output code is exectured.
- A progress bar shows request completion.
- When successful, a new view button is generated to display the chart in the Visualization Area.
- You can ask a follow up question within the same conversation in ChatMDV.
- You can also access previous prompts and continue conversations.
C. Example MDV Project, ChatMDV-Generated View
- After execution, ChatMDV creates a new visualization in MDV.
- Generated views include:
- Descriptive view names and plot titles added automatically by ChatMDV.
- You can open the settings dialog to adjust parameters (e.g., color scheme, axes, labels).
- These plots appear in the Visualization Area and can be saved into Views & Annotations for organization.
✅ Together, these panels show how you move from:
- Landing view (A) → 2. Conversational analysis in ChatMDV (B1–B3) → 3. Generated visualizations in MDV (C).
5. Using ChatMDV (LLM Assistant)
ChatMDV integrates a conversational AI assistant for analysis inside MDV.
- Open the ChatMDV Panel.
- Type a natural language request, e.g.: Show me a histogram of RER1 expression.
- ChatMDV will:
- Identify the dataset column(s)
- Generate the requested chart
- Display it in the Visualization Area
- Tips for best performance:
- The suggested questions are good examples of questions displaying biological interest and also they demonstrate the structure of a question best understood by ChatMDV.
- When using ChatMDV is best to identify the exact dataset column names and type of chart you would like to plot.
Example queries for the pbmc3k dataset:
- “Plot a 3D scatter of PC1, PC2, PC3 colored by leiden cluster.”
- “Plot the same graph as previously but colour it by the leiden clusters”
- “Create a violin plot comparing expression across conditions.”
ChatMDV in Action
Explore our video tutorials to see ChatMDV in use. These demonstrations showcase a variety of query types and workflows, helping you learn how to interact with the assistant and generate visualizations effectively.
6. Best Practices
- Use ChatMDV for exploratory plotting and rapid insights
- Use manual chart tools in MDV for publication-quality figures
- Save Views often to preserve progress
- Ensure variable names are clear and consistent before loading datasets