Multi-Dimensional Viewer (MDV) Documentation
Summary
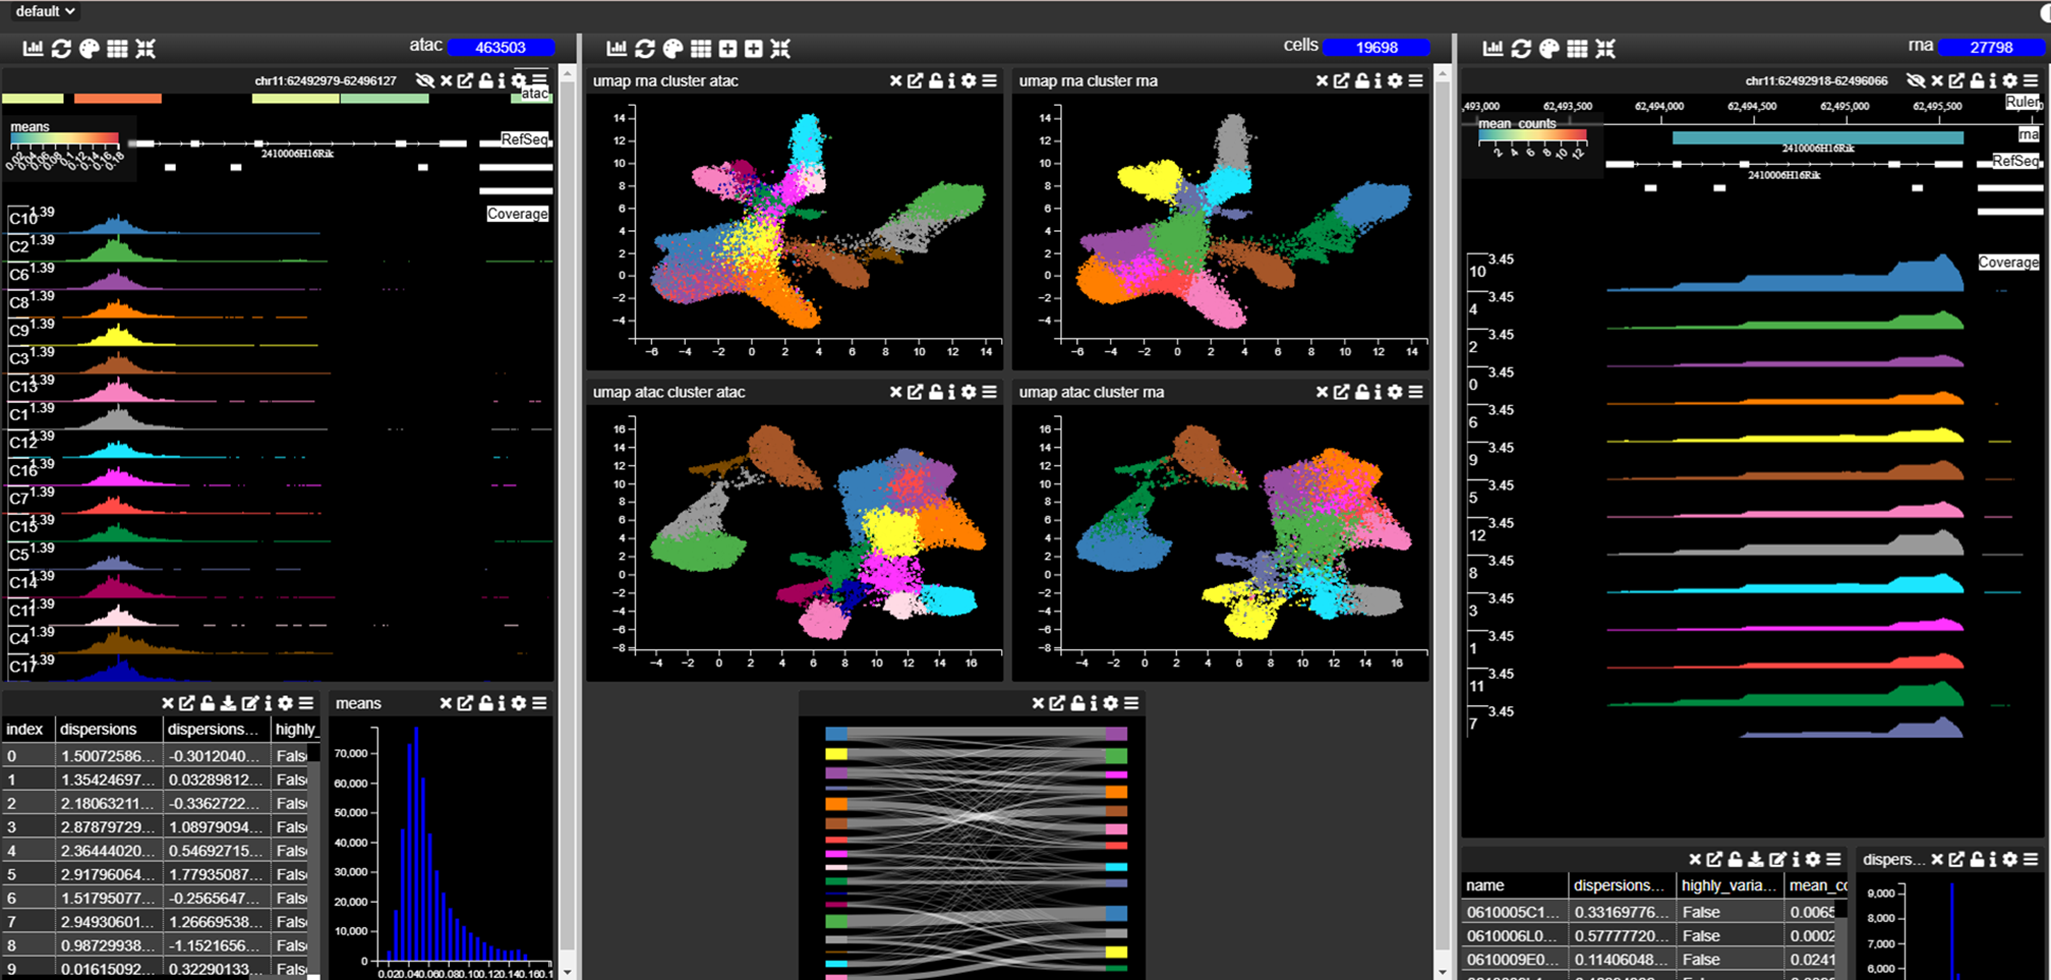
Multi-Dimensional Viewer (MDV) enables the user to visually inspect and query the underlying data from omics experiments such as scRNA-seq, scATAC-seq, spatial transcriptomics, and spatial proteomics. In production, uploads support .csv, .tsv, and .txt files. In local development (localhost:5170, used by developers), MDV also supports additional development file types such as .h5ad.
Each MDV project consists of multiple Views, which contain tables of data that can be queried and visualized. Views can be thought of as dynamic slides in a presentation, helping users tell a story with their data using various visualization tools.
Key Features
- Large assortment of interactive charts/widgets such as spreadsheets, genome browser, image viewer and 3d scatter plot
- Multiple views of the same data
- Charts/Widgets can pop out into separate windows to take advantage of multiple screens
- Multiple data sources (tables) can be loaded and links defined between them
- Data can be added and/or modified by the users
- Diverse range of data sources (API calls, static files) can be used by implementing custom data loaders
Getting Started
- Create a project by uploading your data
- Learn about Views and Visualization
- Explore our comprehensive Chart Types
- Check out Permissions and Sharing
Need Help?
- Browse our FAQs
- Check our troubleshooting guide