Views and Visualization
Views
Views are the canvas that you add your charts to. You can access all the available views in the drop down filter at the top left of the MDV project window ( ).
If your screen is getting very crowded with charts, then add a new view.
Adding a View
You can add or delete a view using the + or - buttons next to the Select View drop down menu. When you do this MDV will ask you if you want to save the view (as a reminder, in case you need to save your work) as you will be moving to a new View and anything not saved will be lost. Then it will give you options to Clone the current view which will allow you to make a copy of that View complete with the underlying data and charts. It will then switch to that View.
Adding Graphs/Charts
Charts help visualize data and allow intuitive filtering by selecting regions on plots or interacting with chart elements. Each filter automatically updates all charts, the table, and the browser to reflect the filtered data.
- Move charts by dragging the title bar.
- Resize charts using the icon at the bottom-right corner.
- Remove charts with the trash icon.
Adding a Chart
- Click Add Chart.
- Select a Chart type.
- Choose the fields to display.
- Name the chart.
- Adjust settings using the gear icon (
 ).
). - The palette icon is used to select channels with spatial omics data (
 ).
).
Chart Settings
Each chart may be customized in settings. Chart settings allow you to change properties such as title, description and which axes. There are often many options to change the underlying data and look and layout of the chart.
Furthermore, for when changes axes it is possible to refer to a:
- Column in the same table
- Link to a column in another table
- Dynamically link to a column in another table
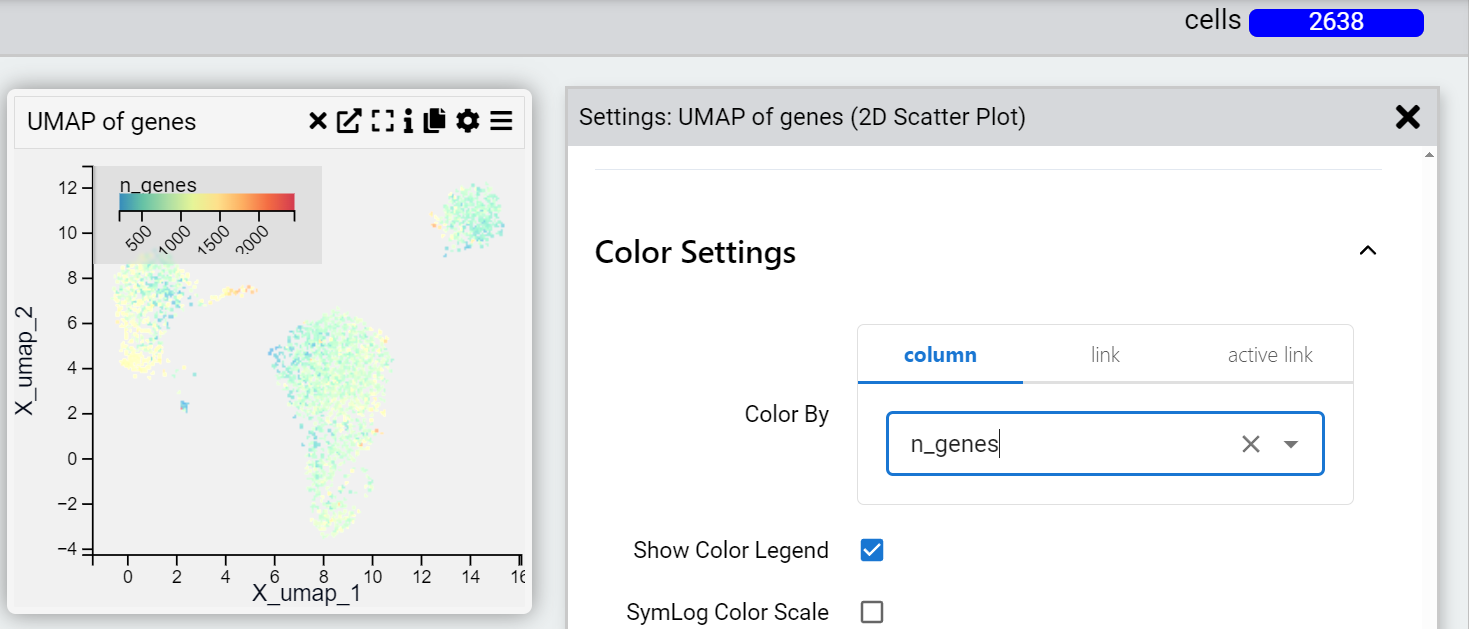
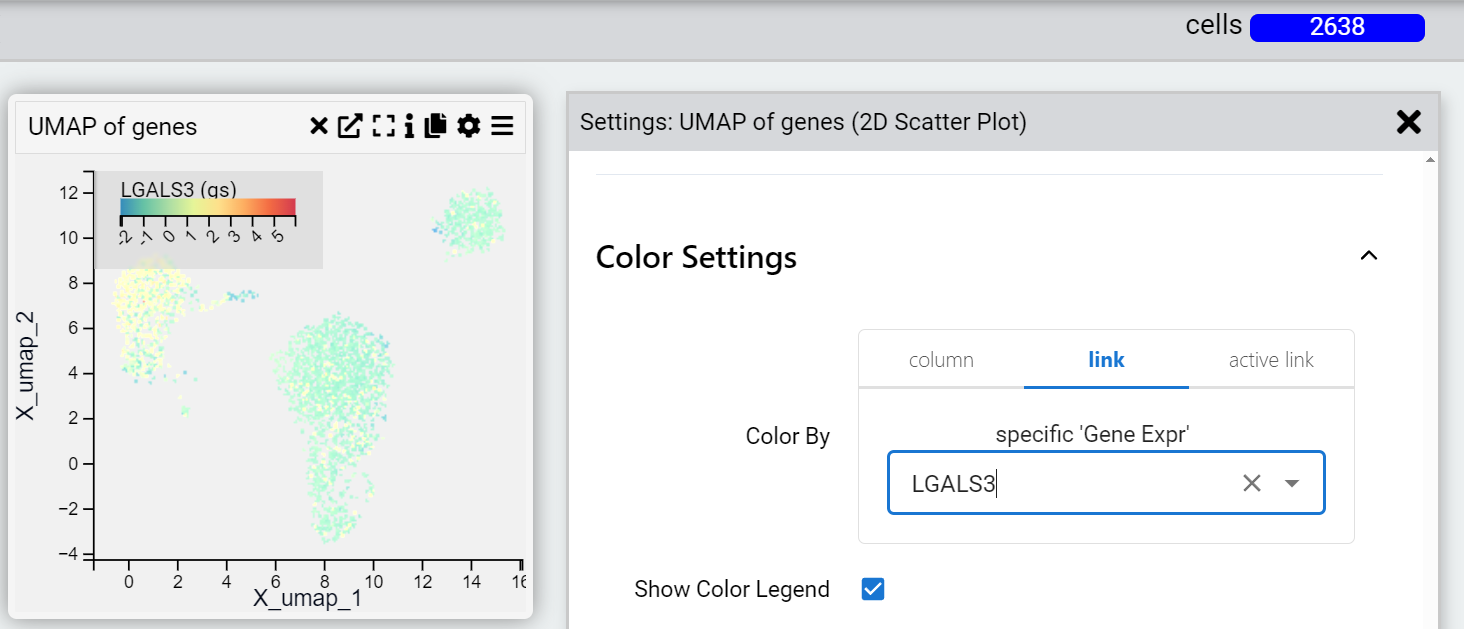
For example, a scatterplot is made based on the values of the column UMAP_1 and UMAP_2 in the "cells" table of an anndata object. The points in the UMAP maybe be coloured to reflect using the "Color by" setting to reflect:
1. A property in the "cells" table.

2. The expression value of a particular gene in the "genes" table

3. Dynamic linking with active updates
The expression value of a particular gene in the gene table that automatically updates when you change the filter. You can also add multiple genes in the "genes" table and where the chart can display it (for example a dot plot of gene expression) you will see all the genes dynamically added to the chart.
