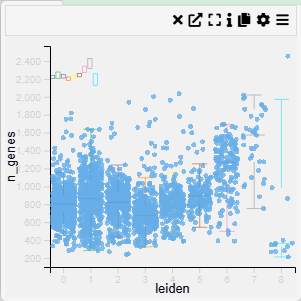
Box Plot
Examples
Context
A box plot is a visualization used to summarize the distribution of numerical values across different categories. It highlights key statistical metrics such as the median, quartiles, and outliers, providing insights into the spread and variability of the data.
Inputs
- Category (X-axis, categorical variable)
- Value (Y-axis, numerical variable)
Settings
- Chart Name (customizable title)
- Chart Legend (define or modify legend text)
- Band Width (adjustable width for distribution smoothing)
- Intervals (control the number of divisions in the data representation)
- Point Opacity (adjust transparency of individual data points)
- Point Size (set size of data points for better visualization)
Axis Controls
- Rotate Y-axis labels (toggle label orientation for readability)
- Y-axis text size (adjustable via slider)
- Y-axis width (modify axis width for layout optimization)
- Rotate X-axis labels (toggle orientation for better fit)
- X-axis text size (adjustable via slider)
- X-axis height (modify spacing to accommodate longer labels)
Color Settings
- Color By (choose a variable for color encoding)
- Show Color Legend (enable/disable color legend)
- SymLog Color Scale (apply logarithmic scaling for better contrast)
- Trim Color Scale (adjust percentile range for color mapping)
- Treat Zero as Missing (exclude zero values from visualization)
Tooltip & Interaction
- Show Tooltip (enable or disable tooltip display)
- Tooltip Value (choose which information appears in the tooltip)
- Centre Plot (reset and centre the visualization)
Filtering & Display
- Action on Filter
- Hide Points (remove filtered-out points)
- Gray Out Points (retain but dim non-selected points)