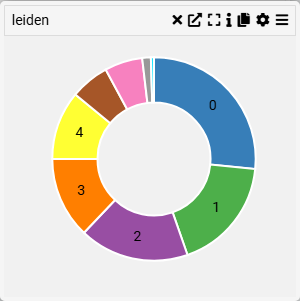
Pie Chart
Examples
Context
A Category Bar Chart visualizes categorical data distribution, where each category is represented by a bar whose length corresponds to its value. This type of chart is useful for comparing different groups within a dataset.
Inputs
- Category (X-axis, categorical variable)
Settings
- Chart Name (customizable title)
- Chart Legend (define or modify legend text)
Parameters
- Category (select the categorical variable to display)
Axis Controls
- Rotate X-axis Labels (toggle orientation for readability)
- X-axis Text Size (adjustable via slider)
- X-axis Height (modify spacing for better label visibility)