2D Scatter Plot
Examples
Context
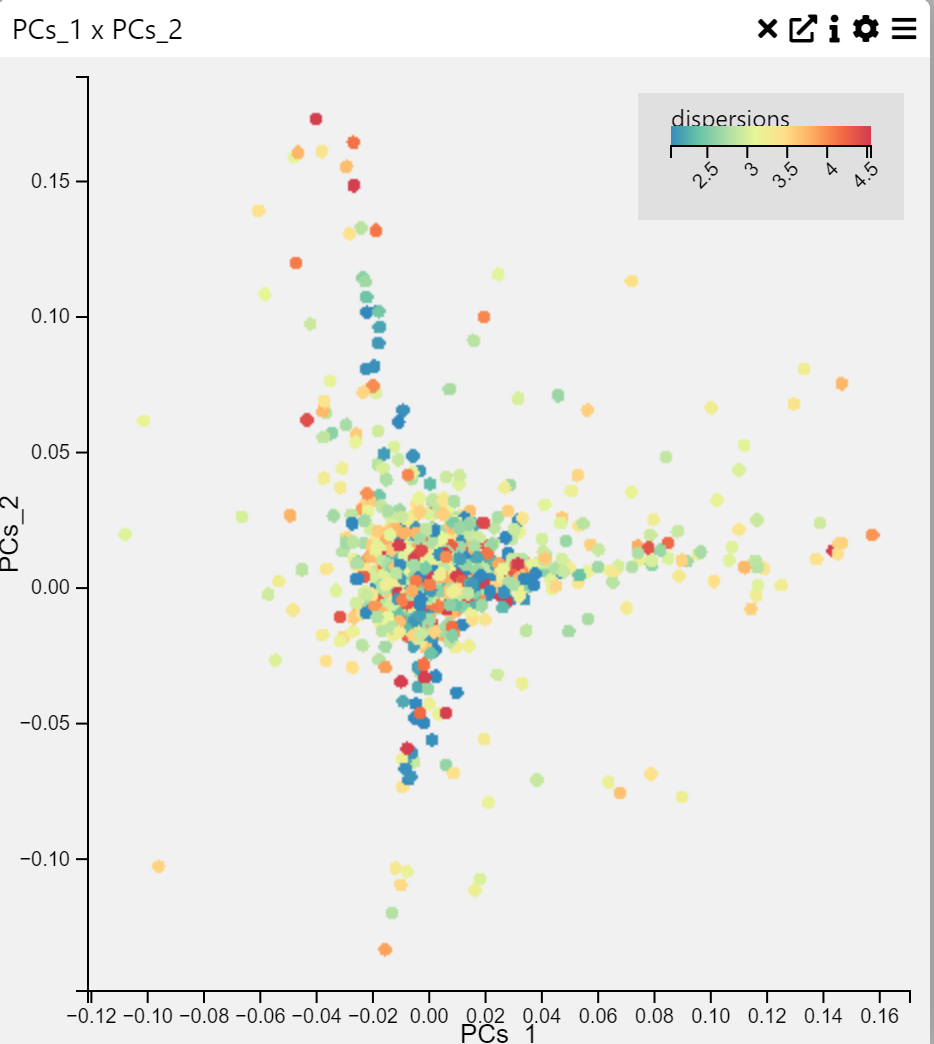
A 2D Scatter Plot is a visualization that displays points on a two-dimensional graph to reveal relationships between two numerical variables. Each point represents an observation in the dataset.
Inputs
- X-axis (numerical variable)
- Y-axis (numerical variable)
Settings
- Chart Name (customizable title)
- Chart Legend (define or modify legend text)
- Point Opacity (adjust transparency of points)
- Point Size (modify size of data points)
Axis Controls
- X-axis (select a column for X values)
- Y-axis (select a column for Y values)
- Rotate Y-axis labels (toggle rotation for readability)
- Y-axis text size (adjust text size via slider)
- Y-axis width (modify width for layout optimization)
- Rotate X-axis labels (toggle rotation for better fit)
- X-axis text size (adjust via slider)
- X-axis height (modify spacing for long labels)
Color Settings
- Color By (choose a variable for color encoding)
- Show Color Legend (enable/disable legend)
- SymLog Color Scale (apply logarithmic scaling)
- Trim Color Scale (adjust percentile range for color mapping)
- Treat Zero as Missing (ignore zero values in visualization)
Tooltip & Interaction
- Show Tooltip (toggle tooltip display)
- Tooltip Value (select which data appears in the tooltip)
- Centre Plot (reset and center visualization)
Filtering & Display
- Action on Filter
- Hide Points (remove filtered-out points)
- Gray Out Points (dim non-selected points)
- Background Color
- None, White, Light Gray, Gray, Black
Brush & Selection
- Brush Type
- Free Draw (polygonal selection)
- Rectangle (box selection)
This scatter plot is a powerful way to visualize relationships between variables, detect clusters, and identify outliers in data.