Selection Dialog
Examples
Context
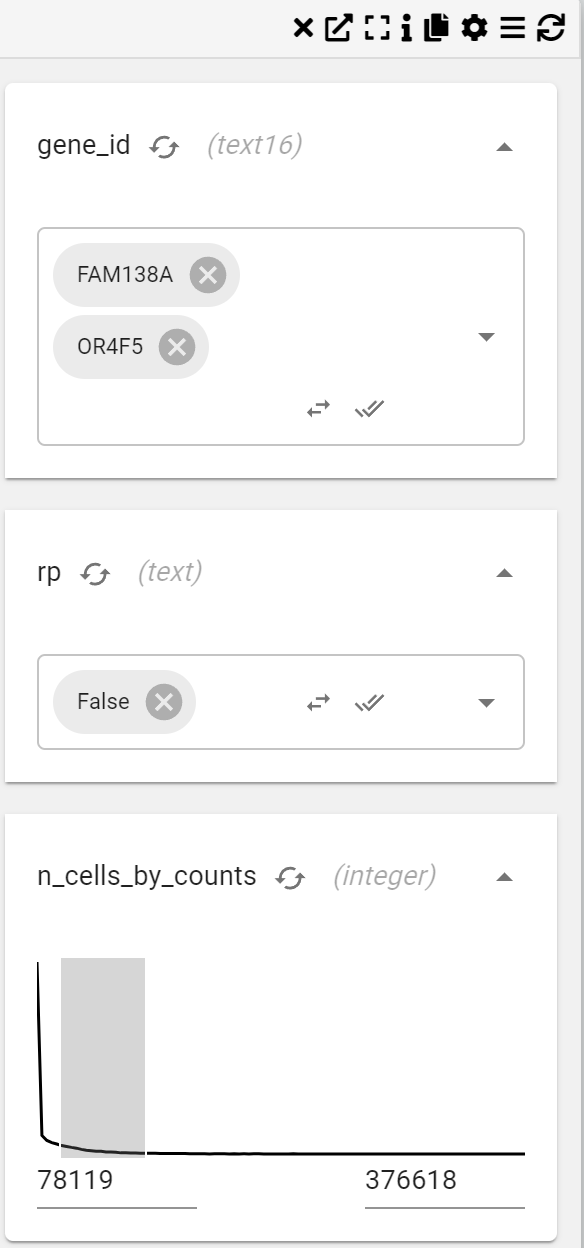
A Selection Dialog or Column Filter Chart enables the selection and filtering of specific columns within a dataset. This chart is useful for focusing on particular variables or subsets of data.
For example, you may want to only show cells that have been derived from a particular disease. Assuming there is a disease column (of data type), You could add a "Disease" filter and that would show a drop down menu containing the disease categories that could be tuned on or off.
If this column was a numeric type, e.g. total_counts (counts of reads per cell) the selection dialogue would show a distribution that can be filtered by dragging a range over the distribution.
Inputs
- Columns to Filter (choose which dataset columns should be filtered)
Settings
- Chart Name (customizable title)
- Chart Legend (define or modify legend text)
- Select particular columns to filter
Interactivity
- Clear Filters (option to remove applied filters)